Demo 4: Interpreting the Correlation Coefficients
File name: correlation/demoMTGP_normalizedcorrelation_phaseshift.m
MTGP models are based on the correlation between tasks. Therefore, the analysis of correlation coefficients between tasks should be possible. However, the correlation matrix K_c is effected by the y-scaling of the tasks. This demo contains an example that illustrates how the correlation coefficients can be scaled to lie in the range [-1,1] and which may then be compared to the corresponding value of Pearson's correlation coefficient. To use demoMTGP_normalizedcorrelation_phaseshift.m, please include the path of the GPML toolbox or specify the path in ddemoMTGP_normalizedcorrelation_phaseshift.m (line 15).
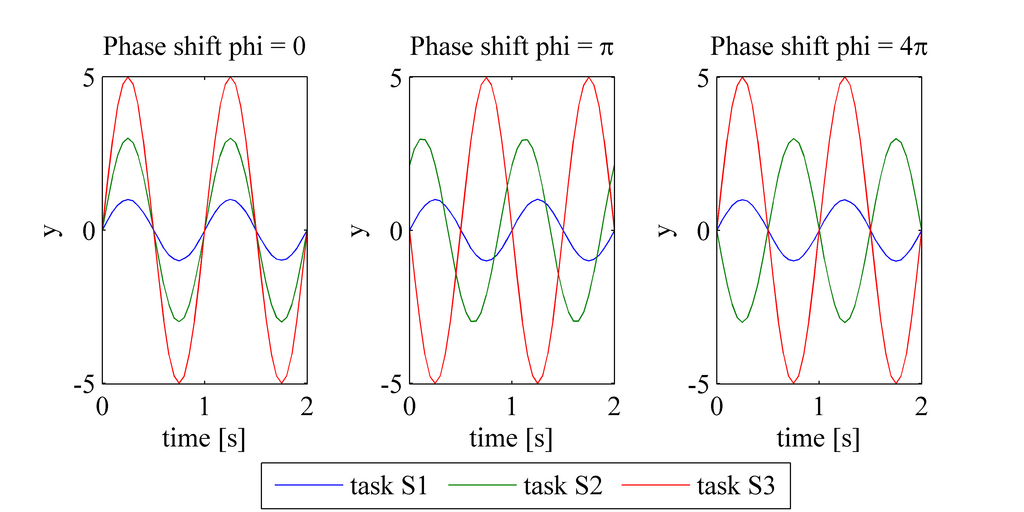
In this example, three sinusoidal tasks are given (see plots above). All points are assumed to be available as training data, and the MTGP model is initialised assuming perfectly-correlated tasks. To investigate the correlation between the task, we add a phase shift phi = [0 4pi] to tasks S2 and S3. For each value of phi within that range, task S2 is shifted by phi/4 and task S3 by phi. The plots above show the training data when phi = 0 (left), phi = pi (middle), and phi = 4pi (right). In contrast to demo 2, no temporal shifts are considered here.
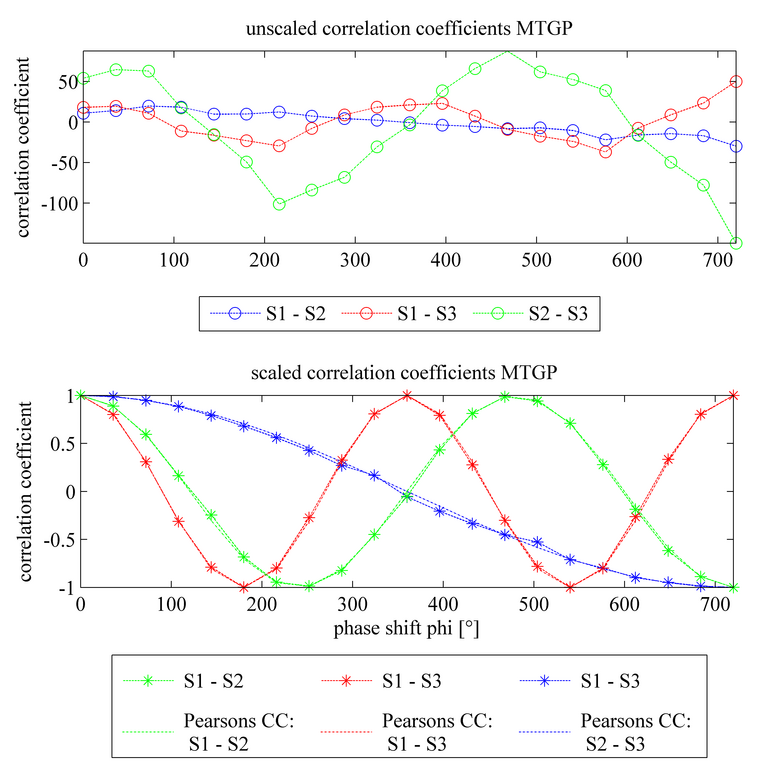
The plots above show the computed correlation coefficients between tasks S1-S2 (shown in blue), tasks S1-S3 (shown in red), and tasks S2-S3 (shown in green) of the MTGP model, for each value of phi in the range phi = [0 4pi]. The upper plot shows the unscaled correlation coefficients obtained from the MTGP model. The correlation coefficients are strongly affected by the y-scaling of the three tasks. A direct comparison to the Pearson's correlation coefficient is difficult as the coefficients from the MTGP do not lie within the range [-1,1]. The lower plot shows the MTGP correlation coefficient after normalisation. It may be observed that this now closely follows the actual value of Pearson's correlation coefficient between each pair of tasks.

- Research
- SonoBox: A Robotic Ultrasound System for Pediatric Forearm Fracture Diagnosis
- Robotics Laboratory (RobLab)
- OLRIM
- MIRANA
- Robotik auf der digitalen Weide
- KRIBL
- Ultrasound Guided Radiation Therapy
- Digitaler Superzwilling: Projekt TWIN-WIN
- - Finished Projects -
- High-Accuracy Head Tracking
- Neurological Modelling
- Modelling of Cardiac Motion
- Motion Compensation in Radiotherapy
- Navigation and Visualisation in Endovascular Aortic Repair (Nav EVAR)
- Autonome Elektrofahrzeuge als urbane Lieferanten
- Goal-based Open ended Autonomous Learning
- Transcranial Electrical Stimulation
- Treatment Planning
- Transcranial Magnetic Stimulation
- Navigation in Liver Surgery
- Stereotactic Micronavigation
- Surgical Microscope
- Interactive C-Arm
- OCT-based Neuro-Imaging